Lessons Learned from a Legionnaires Outbreak in NYC That Can be Applied Now
September 15, 2020 – By Amen Ra Mashariki
The myriad issues we are dealing with around the spread and impact of COVID-19 in city centers reminds me that we must be forever vigilant when it comes to ensuring government, local NGO, relevant private sector and national and global health data is updated, available and accessible. In 2015, 128 New Yorkers were infected and 12 people died as Legionnaires bacteria spread through untreated water in a building’s cooling tower. During that time, I was New York City’s Chief Analytics Officer, leading the Mayor’s Office of Data Analytics. My job was to translate challenges like this into questions that could be answered using analytics, and get agencies to use their data in a new way.
What I learned then is that Legionnaires can be a fatal form of contagious pneumonia that preys hard on the elderly and people with compromised health. Legionella bacteria are found in different freshwater environments, such as water tanks, hot and cold water systems, and cooling towers, but it grows especially well in warm water. People become infected by inhaling contaminated droplets and mist released from water systems.
One of the main sources is contaminated central air conditioning cooling towers. There are over one million buildings in New York City, many of which are decades old, and the city has limited resources for inspection. Where do you begin?
Machine Learning Can Help a Human Crisis
During the 2015 outbreak, we began with data to identify locations with the biggest risk for potential outbreaks. At the time, New York City did not have an existing list of cooling tower locations. The team worked around the clock for weeks pulling in fragments of information from multiple agencies. We built a data management process from scratch to gather, integrate, and ensure the quality of cooling tower inspection data on a daily basis. From this, we built a machine learning algorithm.
Machine learning refers to a set of data-driven algorithms and techniques that automate the prediction, classification and clustering of data. Machine learning can play a critical role in spatial problem solving like this one — where do we even begin to look for deadly bacteria in a city of 8.5 million people?
We used machine learning to identify buildings likely to have contaminated cooling towers by understanding cooling tower locations based on building types and land attributes. The team was able to raise the hit rate for identifying cooling tower locations from 10% to 80% with data. That means, every 8 in 10 attempts to identify a building with a cooling tower was successful. The bottom line? Building inspectors were able to identify contaminated cooling towers faster and save lives.
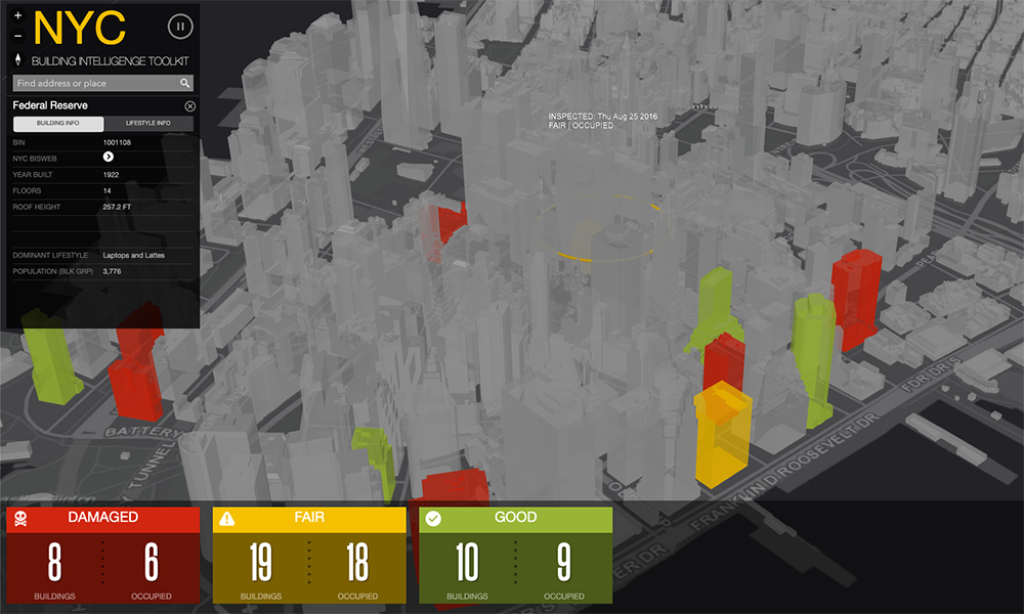
From this machine learning project, the Building Intelligence tool was born. The tool is a 360-degree reconciled database for buildings that provides information more quickly and easily to agencies across the City.
The Legionnaires cluster was located in buildings without a cooling tower, but they were connected and shared a hot water supply. Three became infected and one died over the course of a year. The simple fact that a common variable was identified in these separate cases over this long period of time is thanks to the City being prepared and having data at the ready.
Emergency Drills are for Data too
I’m confident that New York City will be able to contain this cluster so it doesn’t lead to an outbreak like what we had three years ago, but during the next emergency, invariably, we will find we need access and answers to something we don’t know we need. This is what I call the unknown unknown – data we don’t even know we don’t possess.
How can we possibly collect data on everything we may possibly need? That’s where data drills come in handy. When faced with an emergency, we come upon challenges and significant data gaps. As a result, we become aware of needs we could have never predicted prior to that crisis and can fill those demands before such emergencies get completely out of hand.
Data drills are a concept that started in New York City. They are developed and conducted based on a specific operational challenge involving data and require multi-organizational cooperation to achieve a desired result. They can be designed for individual scenarios such as a Legionnaires outbreak or capacity building, asking questions like, “Do we have data on cooling towers and plumbing city-wide?” Data drills can also be used for operations development as well as software testing.
Overall, data drills are a mechanism for helping a city to baseline citywide data practices. They’re also a mechanism for guiding a city towards improving the ability to identify, understand and use data to solve a city challenge when requested in real time.
Data drills make a city smarter about the information it holds and that is key to using data and analytics to make a city safer, smarter, healthier, more efficient, resilient, sustainable, and equitable. Regardless of whether or not urban analytics are immediately necessary to remediate a situation, for any city, data drills should be considered phase zero — constantly running in the background at a cadence that keeps the city’s data ready to be put into action.
Amen Ra Mashariki is a fellow at the Beeck Center and Global Director of the Data Lab at the World Resources Institute. Follow him at @AMashariki.